The idea is that you can understand what's going on in a few seconds, without digging through the journal or interpreting charts.
Your day, at a glance
At the top you see the date and, if you've chosen to track your menstrual cycle, which day of the cycle you're on.
For me, that mattered. For a long time I tracked symptoms and my cycle separately and it never occurred to me to connect them. When I started doing that, certain worse stretches of the month began to make more sense.
I've written more about the link between the cycle and histamine.
Your week
Just below are the seven days of the current week. Each day gets a colour, depending on how you felt: blue-green for a good day, yellow for one where some symptoms turned up, orange for a harder day and cream if you didn't fill in the journal.
That's it. You don't have to open each day to remember how the week went.
You can also go back to previous weeks. This is where it gets interesting, because after a while you start to see things that are very hard to notice from memory: for example, that bad days tend to come in clusters, not quite as randomly as they seemed.
How the month went
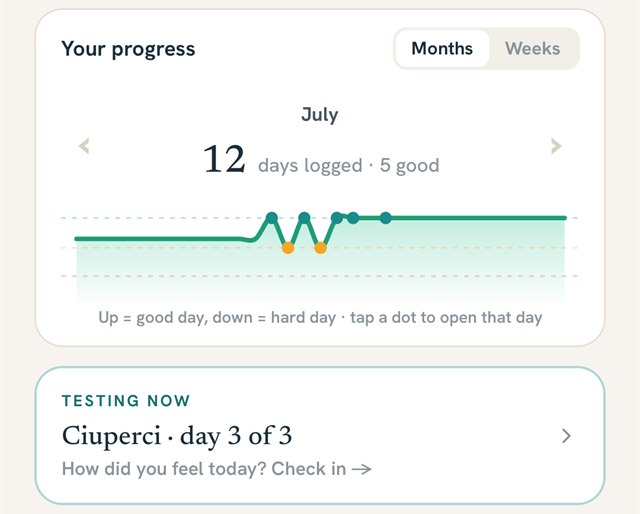
Below that you have your progress over time.
The chart is simple: when the line goes up, you had a better day; when it goes down, a harder one. You can see a whole month or just a week, and you can tap any day to see what you noted then.
At first it isn't very impressive. After a few days it's just a few dots. But after a few weeks the overall picture starts to take shape. And that's exactly when it becomes useful: you're no longer trying to remember how you felt three weeks ago. You have the history in front of you.
If you're testing a food, you see it here too
When you've started a reintroduction, the test shows up right on the home screen: the food you're testing, the day you've reached and the simple question “How did you feel today?”. You can answer straight from there.
I wanted this because it's very easy to start a test in a disciplined way and then, on a busy day, forget about it completely. And if you no longer know how you felt on the second or third day, the test has to be started again and you make much slower progress.
What Histamate has noticed
The last card is the summary the assistant puts together from your journal.
You don't get a complicated report, but a summary in normal language: how many days you filled in, how the week went, when symptoms appeared and what's worth watching more closely, what trends show up.
For me, the interesting part starts here. Because the summary helps you get to the question memory alone can rarely answer: What was different on the days I felt better or worse? The more days you have noted down, the easier the answer is to look for.
But on the first day?
On the first day, the screen is almost empty.
Seven cream squares. No meaningful chart. No striking observation. And that's how it should be.
MyHistamate doesn't try to draw conclusions about you before it has anything to analyse. As you fill in your journal — usually about two minutes a day is enough — the screen starts to say more and more.
After a while, you no longer have to remember whether the migraines started last week or three weeks ago, whether this month was really better than the previous one, or what you'd eaten on the days you felt well.
You have somewhere to look.
MyHistamate is on the App Store and Google Play
The app has come out of testing and can be installed from the App Store and Google Play.
The first seven days are free and complete, with no card.
For a long time I tried to keep all of this in my head. The problem wasn't just that I forgot. It was that, forgetting the details, I could no longer see the patterns.
The home screen doesn't try to tell you how you should feel. It shows you how you did feel, so you can better understand what keeps repeating.